

Pro
10 machines included, expandable as your needs grow
or €499/mo billed monthly
10 monitored machines included
10 Sync Connect devices included
- 1 hour of remote support / month
- Hosting and ongoing updates
- Database maintenance and backups

With PlantWatch, you can follow machine states, process trends and downtime live and analyze them later
Use measurements and status messages from your MQTT topics for trends, downtime analysis and reports
Bring together events from your Kafka topics to trace production sequences and downtime across multiple machines
Track machine runtime and interruptions using status messages from your RabbitMQ queues
Follow measurements and state changes from your NATS subjects live and review their recorded history
Use the machine data collected in Azure Event Hubs for production analysis and reports in PlantWatch
Sync Connect reads data from your controllers via OPC UA, S7 or Modbus and makes it available to PlantWatch

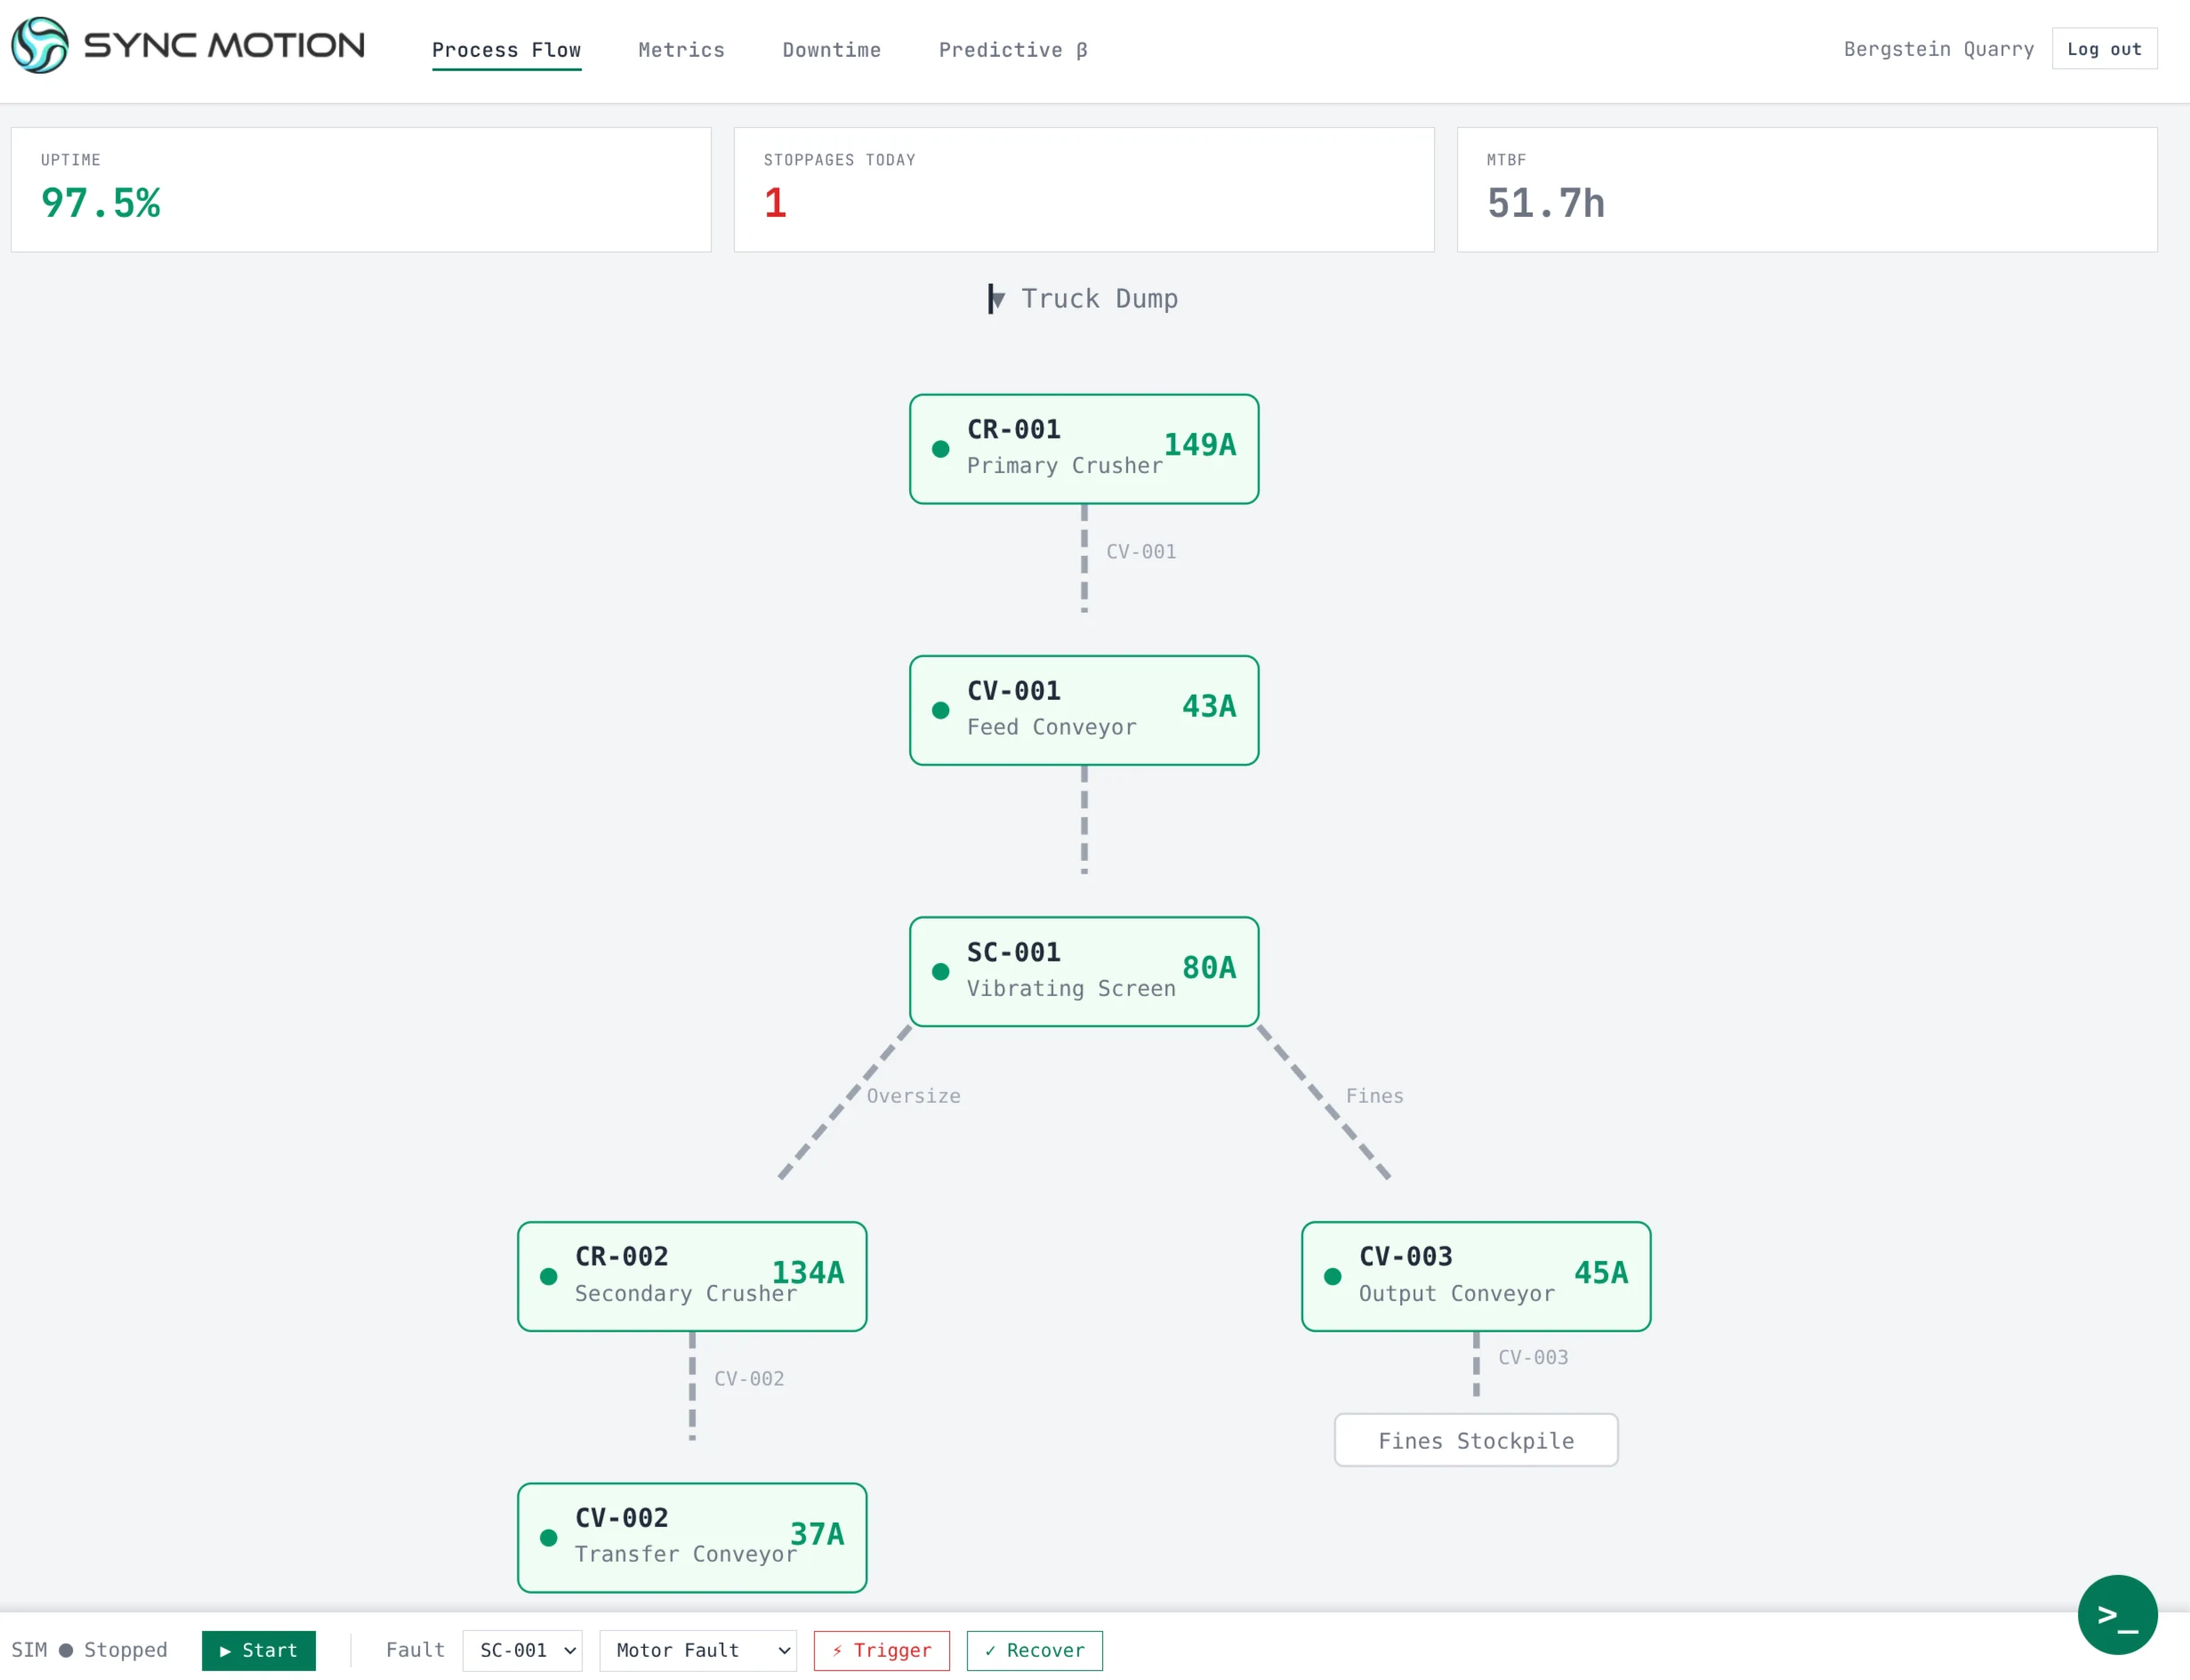
View machine states and current process values in the plant layout

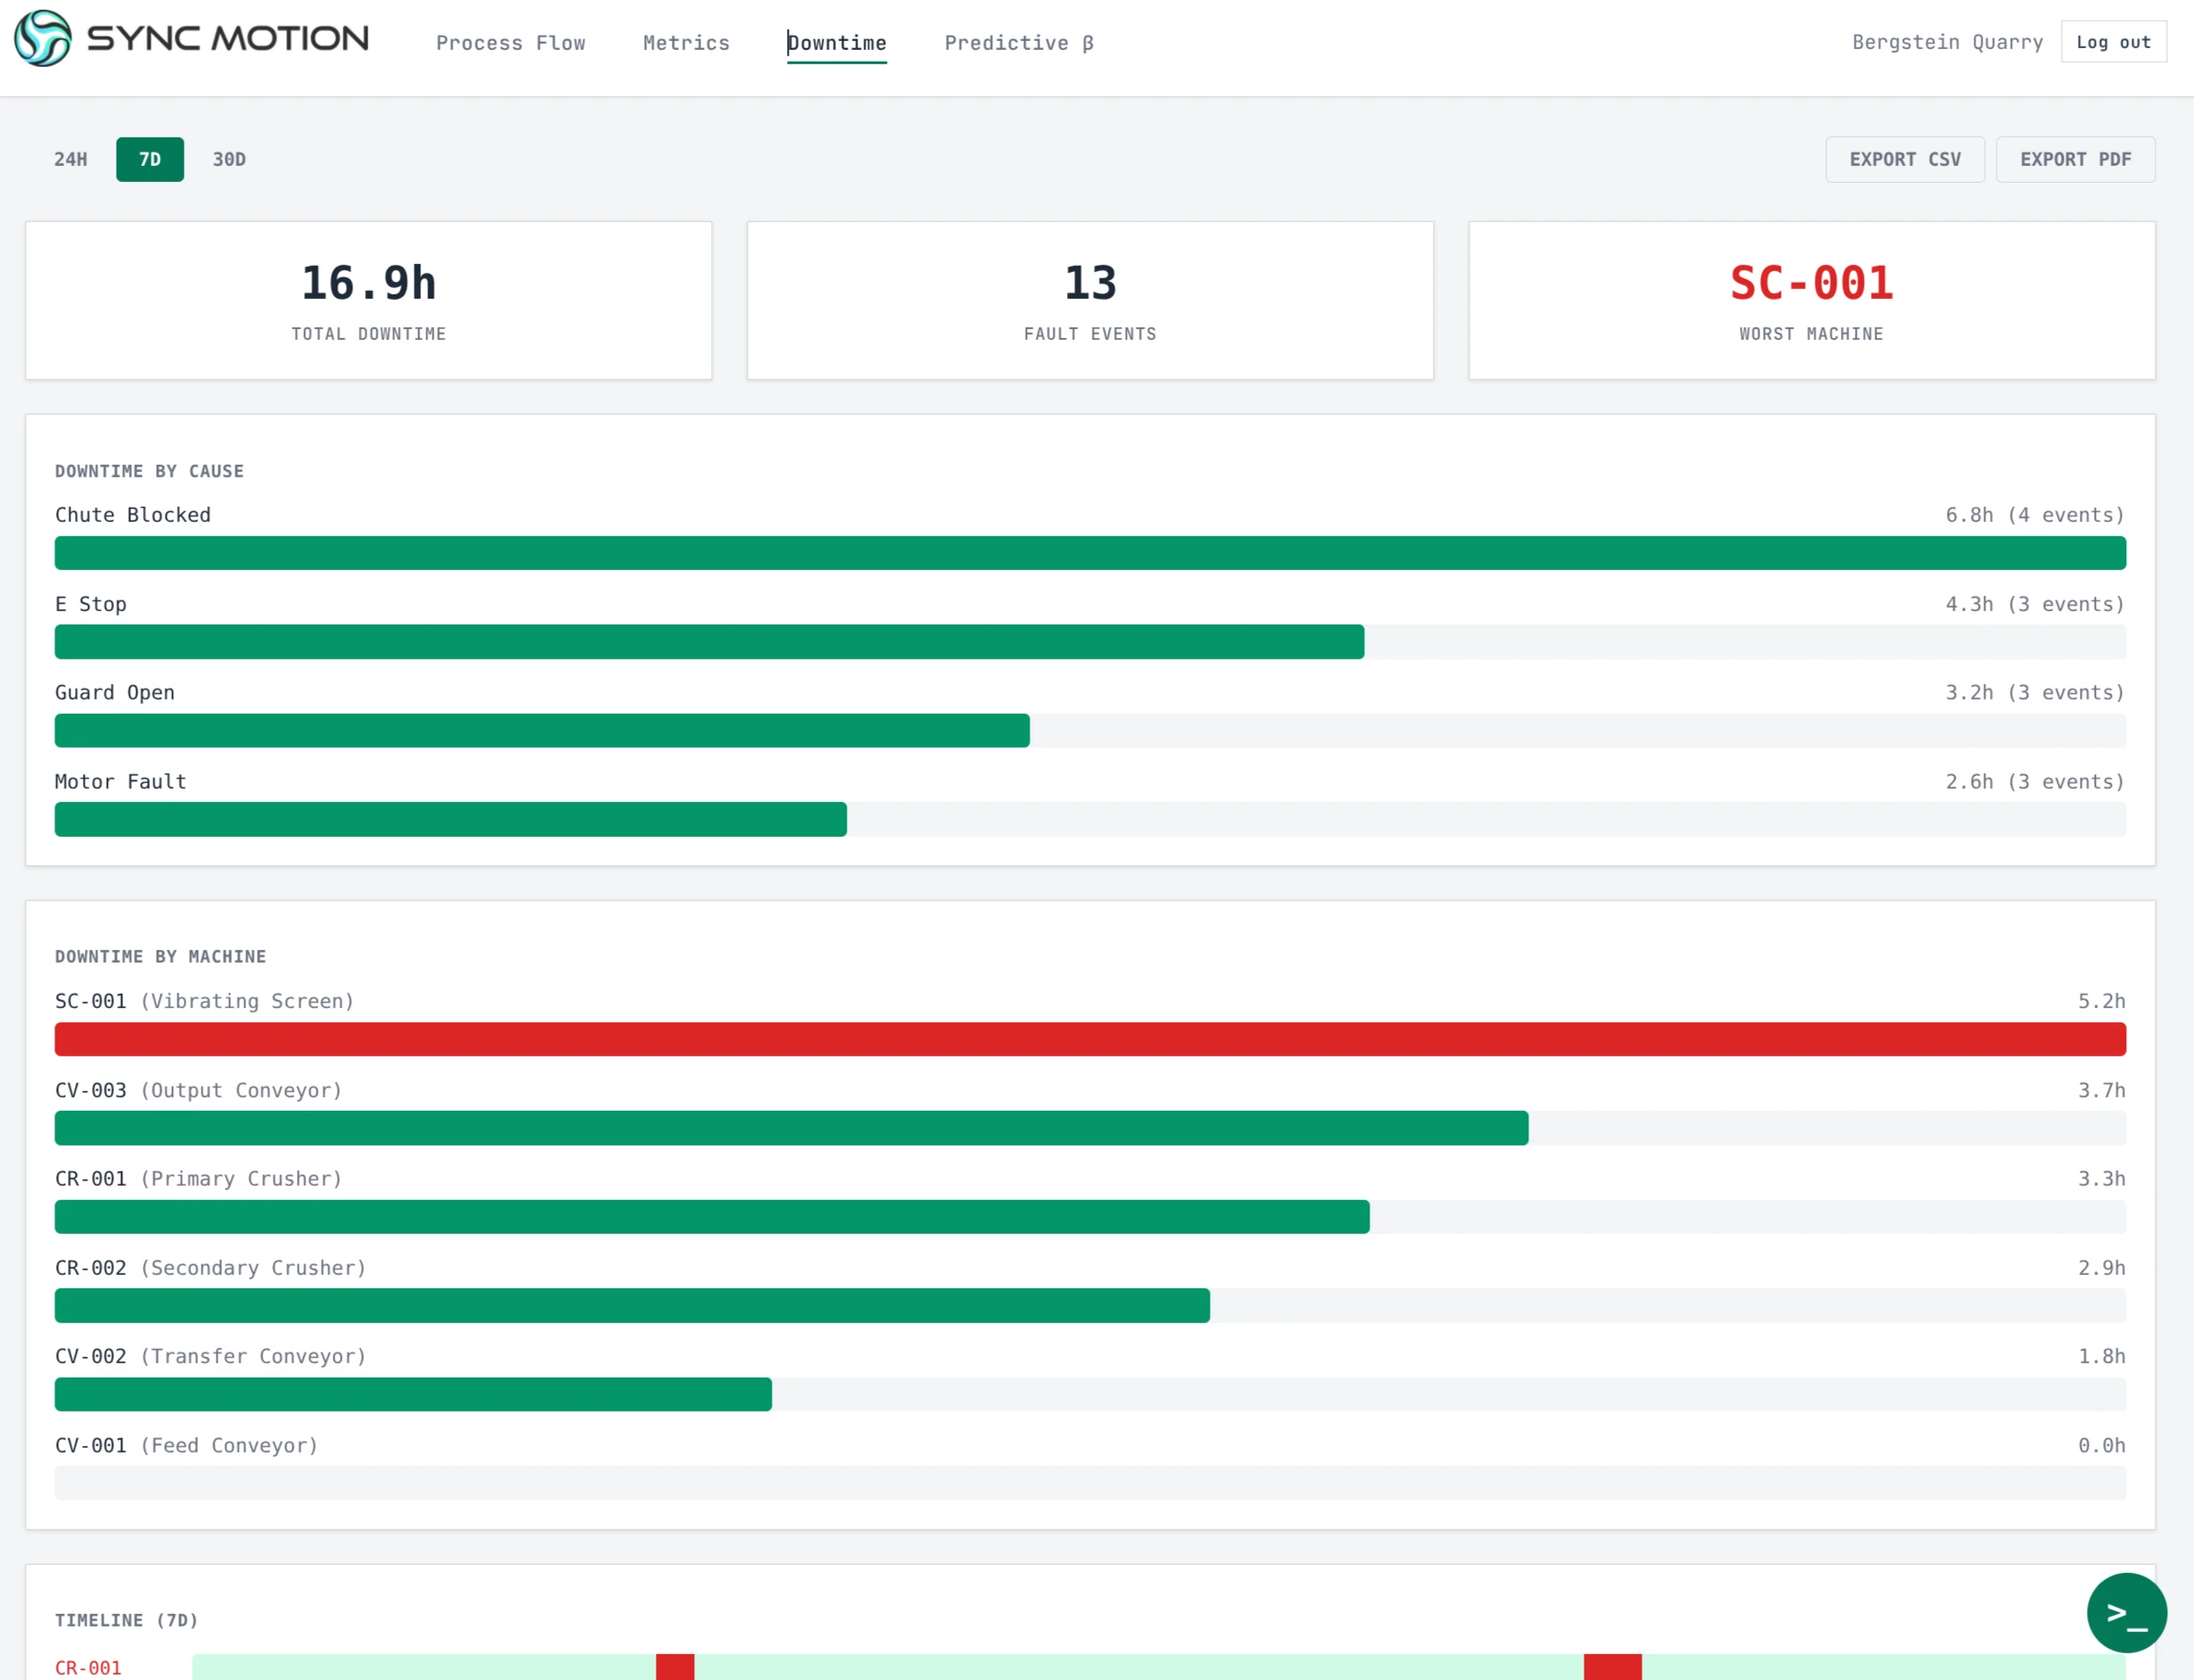
See when your equipment stopped and for how long. Review the recorded states and events in sequence

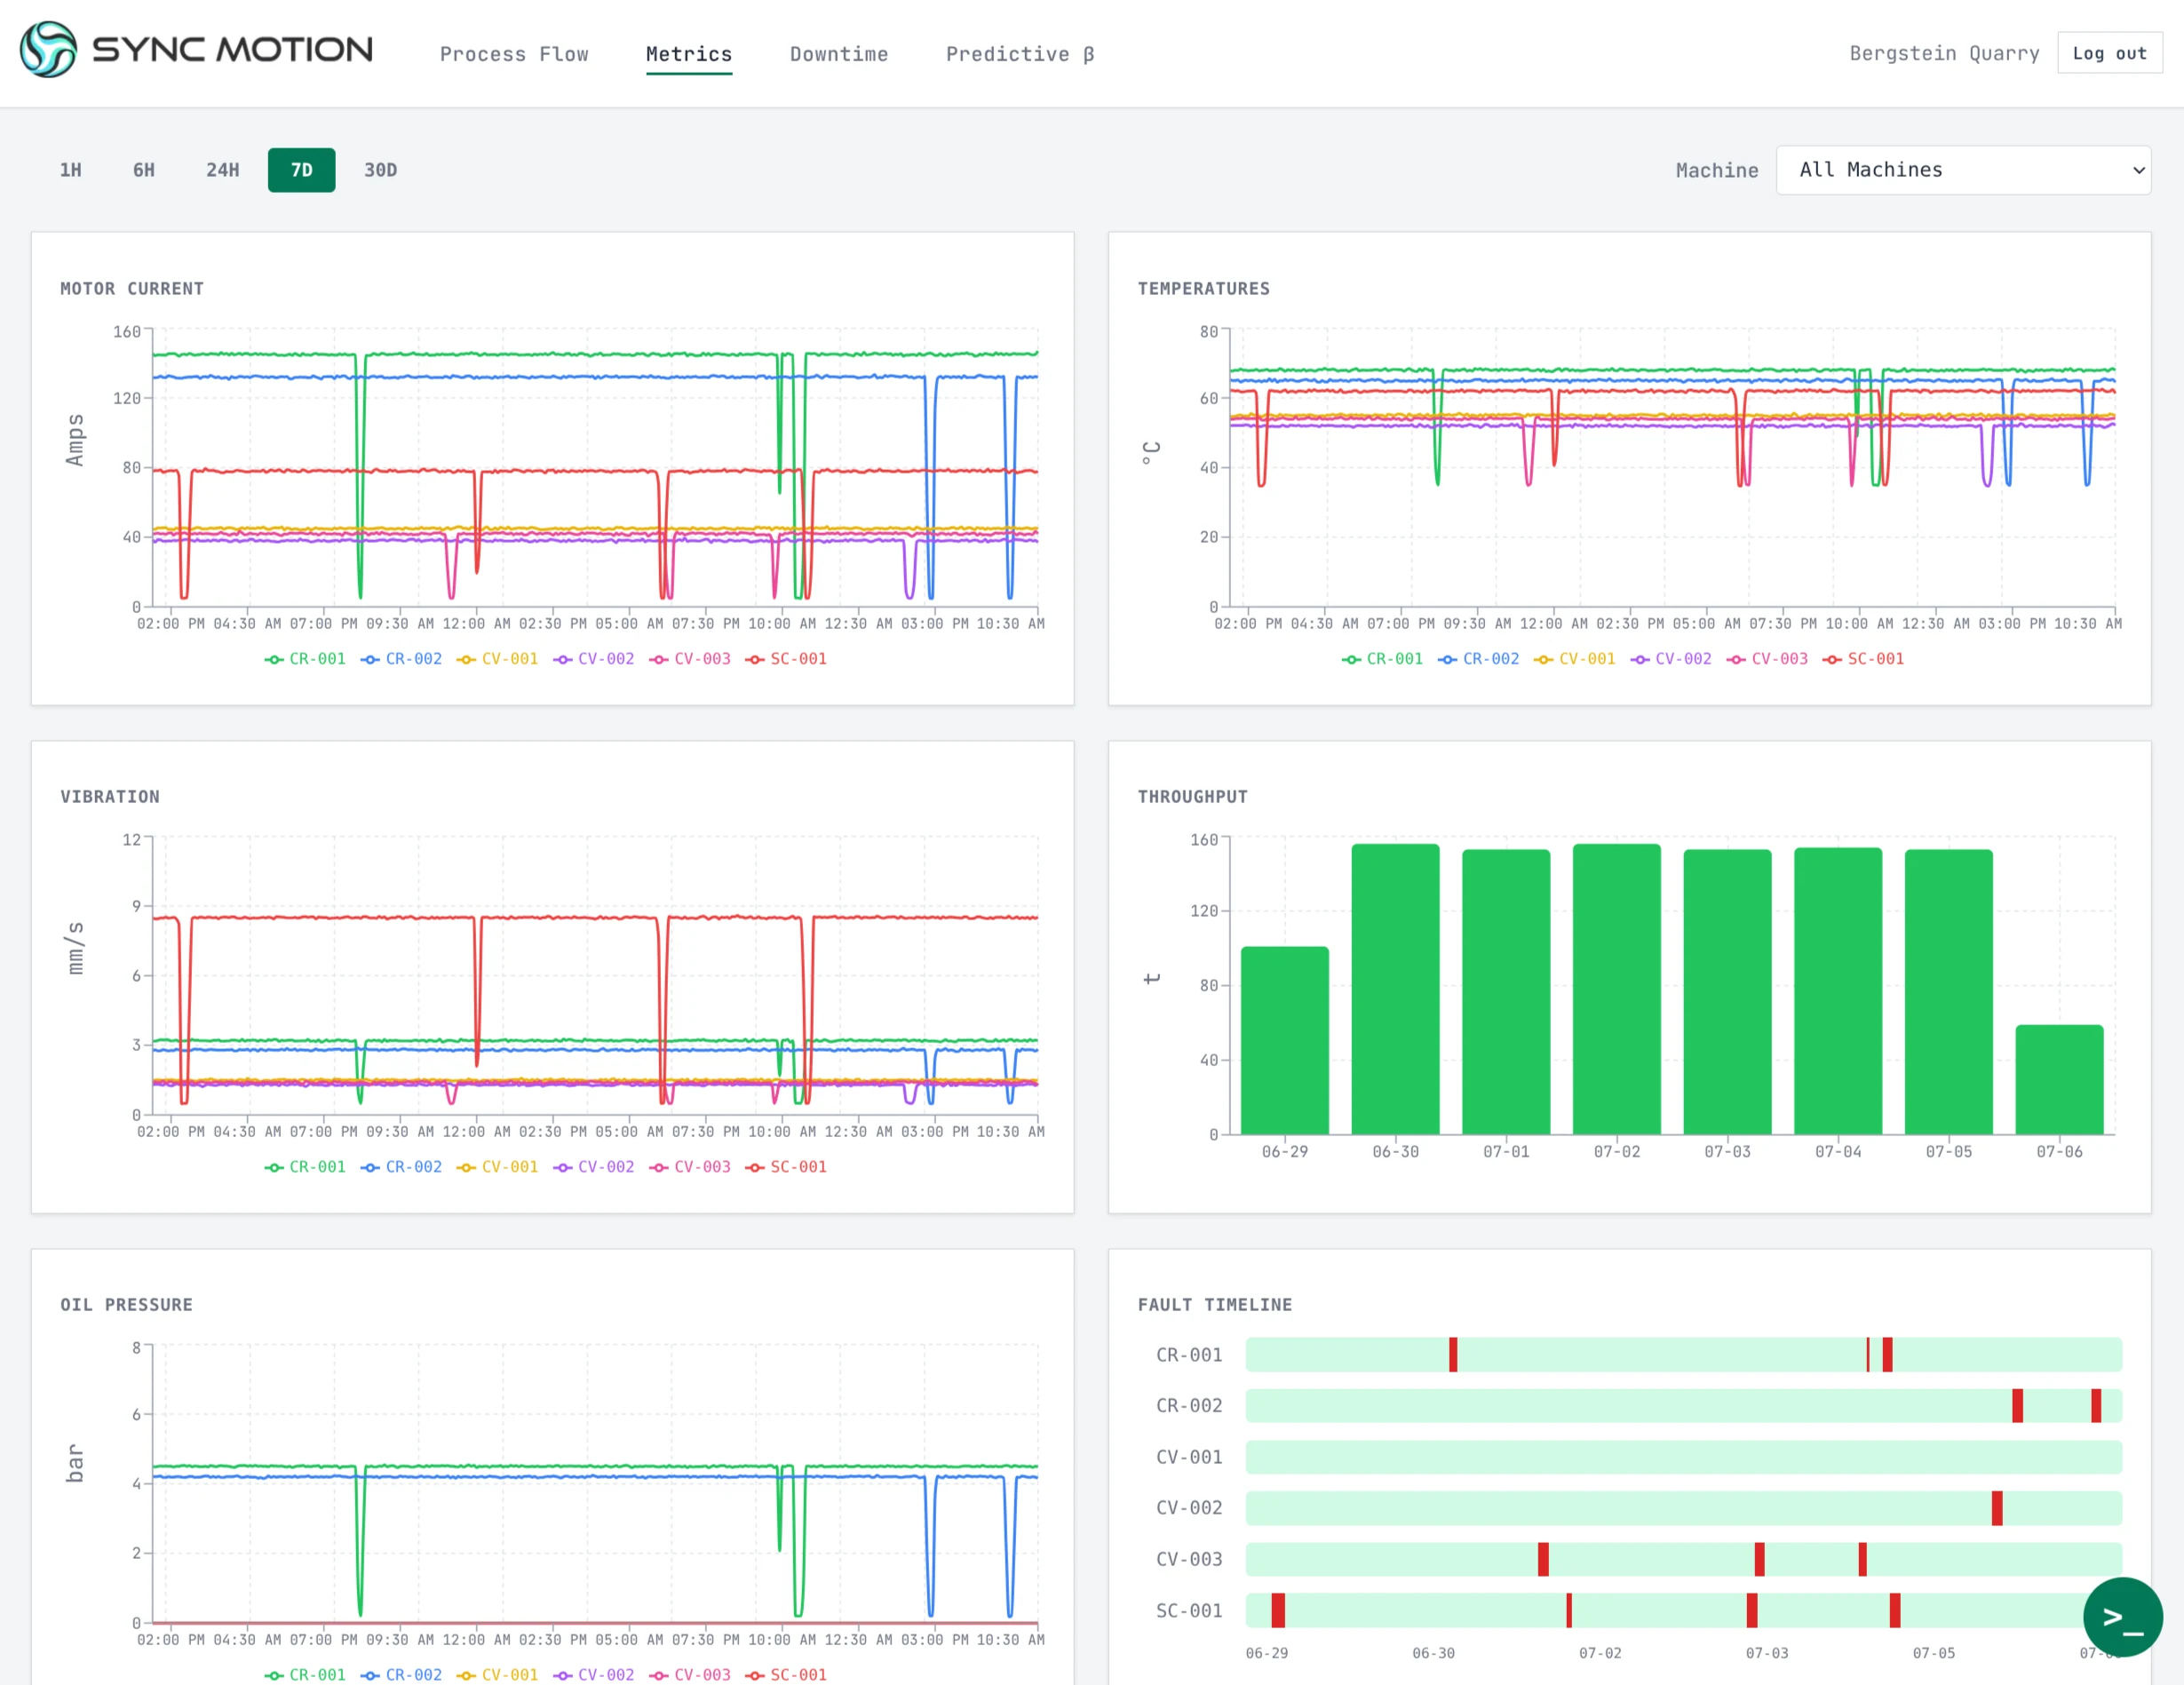
Compare temperatures, loads and other recorded process values across shifts and time periods
Managed cloud includes hosting. With on premises, you provide and pay for the infrastructure
10 machines included, expandable as your needs grow
or €499/mo billed monthly
10 monitored machines included
10 Sync Connect devices included
For 25 machines with more time for remote support
or €999/mo billed monthly
25 monitored machines included
25 Sync Connect devices included
Operation and support tailored to your site
Individual quote
Machines and devices to suit your site
Support hours agreed individually
Around 100 signals from about twelve machines in a Styrian quarry: analyze production and downtime together with PlantWatch
PlantWatch produces a weekly report from the recorded production data
Abnormal temperature readings and motor protection signals revealed a defective motor
Sync Connect transfers S7 1500 controller data via OPC UA and a custom SQL connector to the PlantWatch database. Existing machines, controllers and visualizations remained in use. The data hub was ready after around seven days, and PlantWatch was commissioned in the prepared environment in one more day
Project data flow
PlantWatch uses existing states, alarms and process values from your controllers. Together, we select the signals to record based on what you want to monitor. Connections can use OPC UA, Siemens S7 or Modbus TCP, depending on the available interfaces
Yes. PlantWatch adds production history, downtime analysis and reports alongside your existing systems. It connects as a monitoring layer and reads the selected signals without changing the machine sequence or control logic
PlantWatch can run on your infrastructure or in a managed environment operated by us. For an on premises deployment, production data remains on your server, VM or industrial PC. We agree on the hosting location and data flow before implementation
Yes. You can start with a defined machine, line or production area. The full Pro price also applies when connecting fewer than ten machines. Commissioning is charged separately. The first connection focuses on what you want to monitor. Further data sources can be added afterwards
Tell us which controllers and interfaces are available and what you want to understand about your production. For implementation, we also review network access, documentation, local infrastructure and a technical contact. This determines the scope of preparation and commissioning
Tell us which controllers and interfaces you use and what you want to monitor. We will assess the possible integration and get back to you

Ing. Tobias Brida
Your contact for your integration